Why do some people successfully build exercise habits while others cycle through New Year’s resolutions indefinitely? The standard advice – “just be consistent” – describes the outcome, not the mechanism. This project attempts to formalize the mechanism using dynamical systems theory, grounding every equation in peer-reviewed literature.
The result is a 5-variable model with an interactive visualizer where you can watch different habit formation trajectories play out in real time, inject life events, and explore the phase space geometry that determines success and failure.
The Core Insight: Behavioral Complexity as the Separatrix
The single most important finding from this model is that behavioral complexity (C) – how demanding the behavior you’re attempting is – acts as a separatrix in the state space. There is a sharp boundary between initial conditions that lead to successful habit formation and those that lead to failure, and that boundary is primarily determined by C relative to habit strength H.
A daily 15-minute walk (C ≈ 0.2) succeeds from almost any starting motivation level. A 6-day-per-week gym split (C ≈ 0.9) fails from almost any starting condition. This isn’t just “start easy” – it’s a geometric property of the system. The basin of attraction for the sedentary state expands as C increases, and the basin for the habit state shrinks.
The practical implication: start with the simplest possible version of the behavior. Not because it’s easier (though it is), but because the topology of the state space makes it the only reliable path to the habit attractor.
The State Variables
The model tracks five dynamical variables, each grounded in specific bodies of literature:
H – Habit Strength (Instigation Automaticity)
How automatic the behavior has become. Grows asymptotically when behavior occurs, following Lally et al.’s (2010) finding that the median time to 95% automaticity is 66 days (range: 18-254 days). Decays when behavior stops, but never reaches zero – habits leave a residual trace (Edgren et al., 2025).
The key property: as H grows, behavior becomes less dependent on conscious motivation. This is the shift from goal-directed to habitual control (Daw et al., 2005; Dolan & Dayan, 2013).
M – Motivational Activation
The fast variable. Decays hyperbolically (not exponentially) following temporal motivation theory (Steel & Konig, 2006). Boosted by external events (health scares, social encouragement), sustained by behavioral reward (as prediction error – Schultz, 2016), and drained by effort (reframed as opportunity cost per Kurzban et al., 2013), stress (Schwabe & Wolf, 2009), and indulgent fantasy (Kappes & Oettingen, 2011).
E – Expectation Excess
The gap between what you expect and what’s happening. Drives two failure modes: false hope cycling when reality crushes inflated expectations (Polivy & Herman, 2000), and the “what the hell” effect when a perceived violation triggers catastrophic motivation collapse (Cochran & Tesser, 1996).
I – Identity Coherence
The slowest variable (months-years). Represents “I am someone who exercises” as a self-concept. Only grows when behavior is both occurring AND habitual – isolated gym visits don’t build identity. Once established, identity provides a restoring force on motivation and raises the habit ceiling. Exercise identity is the strongest predictor of long-term maintenance (d = 0.73; Rhodes et al., 2016; Berkman et al., 2017).
C – Behavioral Complexity (Dynamic)
How demanding the target behavior is. Unlike traditional models that treat complexity as fixed, C adapts: failure at high C pushes it down (learning to simplify), while success at low C gradually pushes it up (progressive overload). C finds an equilibrium proportional to H – you can sustain complexity that matches your automaticity.
This means the daily walker (H ≈ 0.7, C ≈ 0.2) and the 3x/week gym-goer (H ≈ 0.6, C ≈ 0.5) are genuinely different equilibria, not the same attractor viewed from different starting conditions.
The Phase Portrait
The most revealing view of the model is the H-C phase portrait, which maps all possible trajectories through Habit-Complexity space:
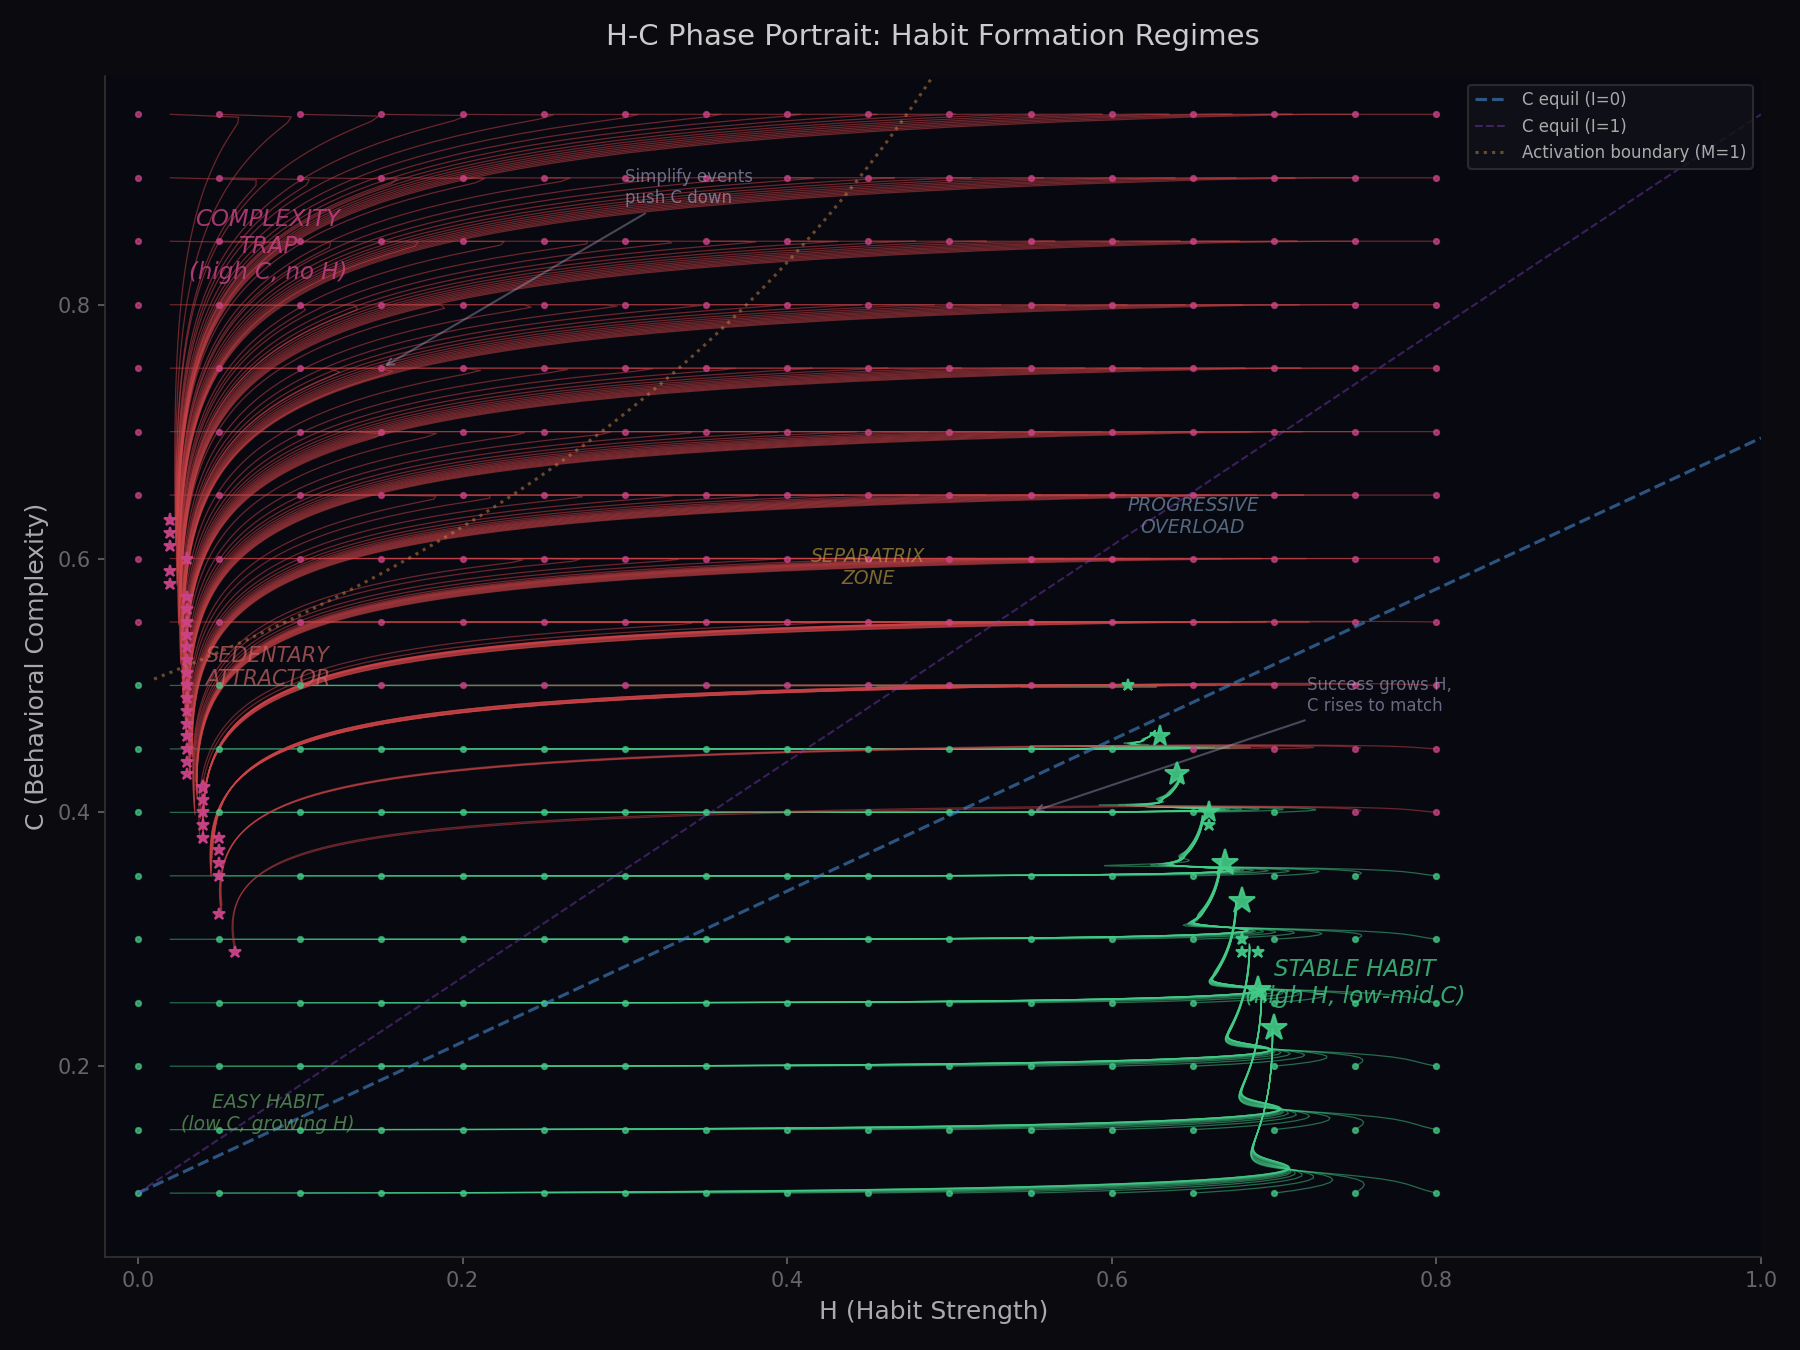
The portrait reveals four distinct regions:
- Stable Habit Basin (lower-right, green): High H, C matched to H. This is where successful habit formers end up.
- Complexity Trap (upper-left, red): High C, low H. The behavioral threshold is too high. Trajectories slide left toward sedentary.
- Sedentary Attractor (lower-left): A true fixed point. No behavior, no habit growth.
- The Separatrix: The sharp boundary between basins. Starting above this line leads to failure; below leads to success.
The separatrix’s position depends on initial motivation – higher M allows higher starting C. But the margin is thin. This is why “just start going to the gym 5 days a week” fails for most people even when they’re highly motivated.
The Behavioral Trigger: Two Competing Systems
Behavior B is computed from two parallel systems, reflecting the neuroscience of goal-directed vs habitual control:
- Goal-directed component: Sigmoid of motivation vs the complexity threshold. When H is low, you need M above C × (1-H) to act.
- Habitual component: H itself drives behavior, but still requires minimum M. Human habits are fragile – five experimental attempts to produce fully automatic (outcome-insensitive) habits in humans all failed (de Wit et al., 2018).
These blend nonlinearly: at low H, behavior is mostly goal-directed; at high H, mostly habitual. A global activation gate ensures B = 0 when M is negligible – you don’t accidentally exercise.
Failure Modes as Trajectory Types
The model naturally produces distinct failure modes, each with a geometric signature in state space:
False Hope Cycling: Large motivational event (New Year’s, health scare) injects high M and inflates E. With high C, H barely increments before M decays. E goes negative (expectations crushed). M crashes. Eventually E recalibrates, another motivational event fires, cycle repeats. In the phase portrait: oscillation in the M-E plane with H stuck near zero.
The Indulgence Trap: High M decoupled from behavior by phantom reward. Watching fitness content, planning routines, fantasizing about results – all of which provide partial reward without incrementing H. M quietly leaks away. In the phase portrait: drift toward sedentary without dramatic events.
Complexity Overshoot: Attempting high-quality execution (high C) from the start. The behavioral threshold C × (1-H) exceeds available M. Effort cost drains M faster than reward restores it. In the H-C portrait: starting in the red zone, sliding left.
The “What the Hell” Collapse: Strict all-or-nothing plan. One perceived violation (birthday cake, missed gym day) spikes E above the collapse threshold. M drops catastrophically. The psychological impact far exceeds the actual effect on H.
Calibration: 2,100 Synthetic Lifetimes
To validate the model, I built a synthetic narrative calibration system: 21 diverse backstories (ages 19-67, multiple genders, occupations, fitness goals) each simulated 100 times over 2 years with stochastic event streams generated via inhomogeneous Poisson processes.
Event streams include motivational shocks, lapses, stress events, injuries, social support, context disruptions, and – critically – simplify events (coach says “just walk”) and escalate events (signed up for a race). Each person has backstory-derived event rates and trajectory archetype weights.
Results were compared against literature-derived population statistics:
| Metric | Model | Literature Target |
|---|---|---|
| Dropped by 60 days | 63% | 50-80% |
| Active at 6 months | 40% | 25-50% |
| Habit fully formed | 33% | 15-30% |
| False hope cycling | 9% | 3-15% |
| Dropout | 10% | 10-25% |
The model produces population-level statistics consistent with empirical data while also generating plausible individual narratives – Sarah the grad student (3% success rate under stress), Tom the remote worker (60% with low complexity), Sam the freshman with the Reddit PPL split (0% until he simplifies).
The Bootstrapping Thesis
The original intuition that motivated this project was that habit formation follows a bootstrapping pattern analogous to polynomial curve fitting: get the first-order term right (time on task), then add second-order refinements (execution quality), then third-order (timing, periodization).
The model formalizes this as a path through H-C space. The optimal trajectory:
- Start at low C (walking, not CrossFit)
- Allow H to grow through the initial motivational window
- As H rises, C equilibrium rises naturally (progressive overload)
- Identity forms as a byproduct of sustained habitual behavior
- The system settles on the C-equilibrium manifold at a complexity level matched to automaticity
Premature escalation of C is the most common failure mode. The model predicts – and the calibration data confirms – that starting simple and building complexity is not just advice but a geometric necessity determined by the topology of the state space.
Try It
The interactive visualizer lets you:
- Watch 10 character narratives play out over 2 years (Sarah the grad student, Marcus the startup engineer, Sam the Reddit gym bro, and more)
- Inject events at any time: motivational shocks, lapses, stress, injuries, simplify/escalate decisions
- Explore the H-C phase portrait with flow field visualization
- Adjust all parameters and initial conditions in real time
- See detailed narrative descriptions for each event at each intensity level
Source code, the full 70+ citation library, calibration data, and the Python simulation engine are on GitHub.
Literature Foundation
This model synthesizes findings from 70+ papers. The key theoretical foundations:
| Concept | Source | Model Element |
|---|---|---|
| Asymptotic habit formation | Lally et al. (2010) | dH/dt growth term |
| Hyperbolic temporal discounting | Steel & Konig (2006) | M decay form |
| False hope syndrome | Polivy & Herman (2000) | E → M collapse |
| Phantom reward of fantasy | Kappes & Oettingen (2011) | Indulgence mechanism |
| Reward prediction error | Schultz (2016) | Diminishing reward |
| Stress-habit shift | Schwabe & Wolf (2009) | Stress → threshold |
| Fragile human habits | de Wit et al. (2018) | B requires min M |
| Exercise identity | Rhodes et al. (2016) | Identity variable I |
| Identity-value model | Berkman et al. (2017) | I → M, I → A |
| Cybernetic self-regulation | Carver & Scheier (1982) | Velocity meta-loop |
| Opportunity cost of effort | Kurzban et al. (2013) | Effort as cost |
| Implementation intentions | Gollwitzer (1999) | Threshold reduction |
| Nonlinear habit decay | Edgren et al. (2025) | Residual floor |
| Dual-system control | Daw et al. (2005) | B_goal + B_habit |
| Habit discontinuity | Verplanken & Roy (2016) | Context disruption |